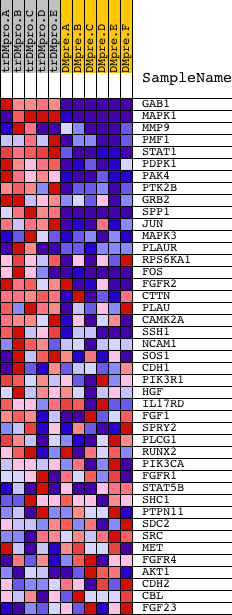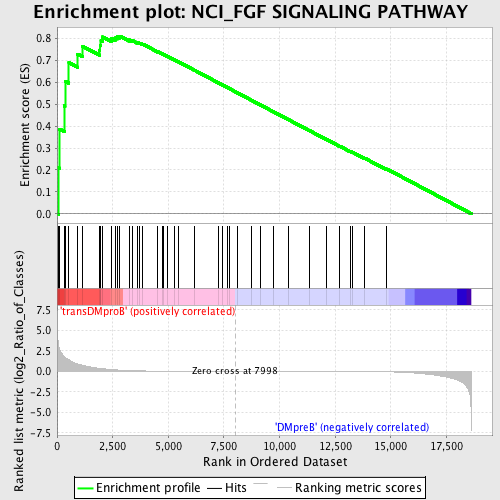
Profile of the Running ES Score & Positions of GeneSet Members on the Rank Ordered List
| Dataset | Set_04_transDMproB_versus_DMpreB.phenotype_transDMproB_versus_DMpreB.cls #transDMproB_versus_DMpreB.phenotype_transDMproB_versus_DMpreB.cls #transDMproB_versus_DMpreB_repos |
| Phenotype | phenotype_transDMproB_versus_DMpreB.cls#transDMproB_versus_DMpreB_repos |
| Upregulated in class | transDMproB |
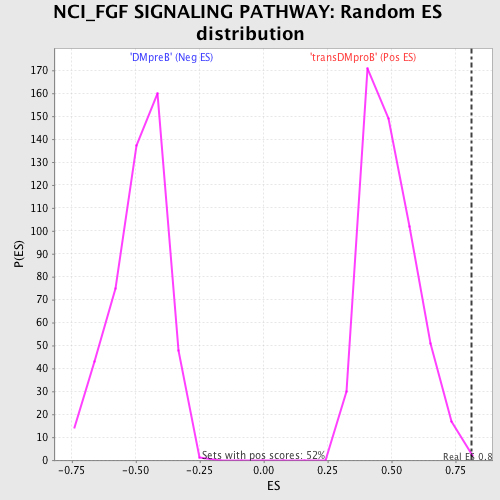
| GeneSet | NCI_FGF SIGNALING PATHWAY |
| Enrichment Score (ES) | 0.8108302 |
| Normalized Enrichment Score (NES) | 1.6462841 |
| Nominal p-value | 0.0038314175 |
| FDR q-value | 0.07082582 |
| FWER p-Value | 0.124 |
| PROBE | DESCRIPTION (from dataset) | GENE SYMBOL | GENE_TITLE | RANK IN GENE LIST | RANK METRIC SCORE | RUNNING ES | CORE ENRICHMENT | |
|---|---|---|---|---|---|---|---|---|
| 1 | GAB1 | 18828 | 64 | 3.185 | 0.2099 | Yes | ||
| 2 | MAPK1 | 1642 11167 | 108 | 2.667 | 0.3862 | Yes | ||
| 3 | MMP9 | 14732 | 329 | 1.767 | 0.4927 | Yes | ||
| 4 | PMF1 | 12452 | 355 | 1.694 | 0.6048 | Yes | ||
| 5 | STAT1 | 3936 5524 | 531 | 1.404 | 0.6894 | Yes | ||
| 6 | PDPK1 | 23097 | 914 | 0.896 | 0.7288 | Yes | ||
| 7 | PAK4 | 17909 | 1147 | 0.717 | 0.7643 | Yes | ||
| 8 | PTK2B | 21776 | 1904 | 0.355 | 0.7474 | Yes | ||
| 9 | GRB2 | 20149 | 1927 | 0.347 | 0.7695 | Yes | ||
| 10 | SPP1 | 5501 | 1971 | 0.334 | 0.7895 | Yes | ||
| 11 | JUN | 15832 | 2037 | 0.313 | 0.8070 | Yes | ||
| 12 | MAPK3 | 6458 11170 | 2440 | 0.214 | 0.7997 | Yes | ||
| 13 | PLAUR | 18351 | 2607 | 0.176 | 0.8025 | Yes | ||
| 14 | RPS6KA1 | 15725 | 2699 | 0.155 | 0.8081 | Yes | ||
| 15 | FOS | 21202 | 2816 | 0.135 | 0.8108 | Yes | ||
| 16 | FGFR2 | 1917 4722 1119 | 3240 | 0.081 | 0.7935 | No | ||
| 17 | CTTN | 8817 4575 1035 8818 | 3379 | 0.068 | 0.7906 | No | ||
| 18 | PLAU | 22084 | 3634 | 0.050 | 0.7802 | No | ||
| 19 | CAMK2A | 2024 23541 1980 | 3717 | 0.046 | 0.7789 | No | ||
| 20 | SSH1 | 10540 | 3858 | 0.039 | 0.7740 | No | ||
| 21 | NCAM1 | 5149 | 4533 | 0.018 | 0.7389 | No | ||
| 22 | SOS1 | 5476 | 4722 | 0.015 | 0.7298 | No | ||
| 23 | CDH1 | 18479 | 4770 | 0.014 | 0.7282 | No | ||
| 24 | PIK3R1 | 3170 | 4940 | 0.013 | 0.7200 | No | ||
| 25 | HGF | 16916 | 5279 | 0.010 | 0.7024 | No | ||
| 26 | IL17RD | 22069 | 5433 | 0.009 | 0.6947 | No | ||
| 27 | FGF1 | 1994 23447 | 6176 | 0.005 | 0.6551 | No | ||
| 28 | SPRY2 | 21725 | 7275 | 0.002 | 0.5961 | No | ||
| 29 | PLCG1 | 14753 | 7415 | 0.001 | 0.5887 | No | ||
| 30 | RUNX2 | 4480 8700 | 7651 | 0.001 | 0.5761 | No | ||
| 31 | PIK3CA | 9562 | 7760 | 0.001 | 0.5704 | No | ||
| 32 | FGFR1 | 3789 8968 | 8129 | -0.000 | 0.5506 | No | ||
| 33 | STAT5B | 20222 | 8729 | -0.002 | 0.5184 | No | ||
| 34 | SHC1 | 9813 9812 5430 | 9137 | -0.003 | 0.4967 | No | ||
| 35 | PTPN11 | 5326 16391 9660 | 9713 | -0.004 | 0.4660 | No | ||
| 36 | SDC2 | 9134 | 10382 | -0.006 | 0.4305 | No | ||
| 37 | SRC | 5507 | 11341 | -0.009 | 0.3795 | No | ||
| 38 | MET | 17520 | 12124 | -0.013 | 0.3383 | No | ||
| 39 | FGFR4 | 3226 | 12709 | -0.018 | 0.3081 | No | ||
| 40 | AKT1 | 8568 | 13176 | -0.023 | 0.2845 | No | ||
| 41 | CDH2 | 1963 8727 8726 4508 | 13270 | -0.024 | 0.2811 | No | ||
| 42 | CBL | 19154 | 13815 | -0.033 | 0.2541 | No | ||
| 43 | FGF23 | 17275 | 14821 | -0.065 | 0.2043 | No |